|
Patterns
worldwide
Patterns within Britain
Patterns within Kent
Comparison of local foraging patterns
The changing environment and declines
in British bumblebees
Bumblebee declines elsewhere in Europe
Conclusion
[For
an updated review see Williams & Osborne (2009
[pdf]).]
During
the 1970s, considerable effort went into mapping the
distributions of British
bumblebees. The Bumblebee Distribution Maps Scheme
(abbreviated below to BDMS) produced an atlas of these
insects for Britain and Ireland (Alford, 1980).
This drew particular attention to the apparent changes
in populations of these important pollinators (Alford,
1973). It has also provided
useful material for advancing an understanding of the
factors that may have brought about these changes.
My
interest in this field developed through attempts to
describe general patterns in bumblebee distributions.
These patterns can be found at many different scales,
ranging from those among continents to those within
fields (Williams, 1985a).
.
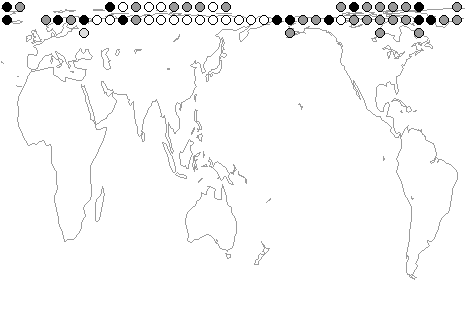
Patterns worldwide
Bumblebees
include about 249 species
worldwide. They rank among the most abundant flower
visitors in alpine, cool temperate, and even arctic
environments of the northern continents (see the map
below). In the tropics and the southern continents,
they are native only in Southeast Asia and South America,
where their centres of diversity are in the high mountains
(Williams, 1985b [map]
). This pattern of worldwide distribution has undoubtedly
been limited in part by poor opportunities for them
to reach areas that are now known to be favourable to
them, such as New Zealand [introduced
species][see also biogeographic
regions]. In contrast, the other social long-tongued
bees, such as honey bees and stingless bees, have their
centres of diversity further south in the tropical lowlands
(e.g. Ruttner, 1987)
[maps
of honey bees and stingless bees].
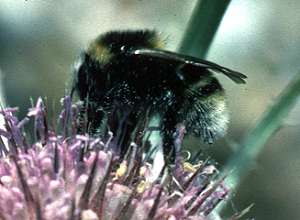
Above:
map showing the recorded distribution of B. (Alpinobombus)
hyperboreus, one of
the most northerly distributed of all bumblebees, among
equal-area (611,000
km²) grid cells, with black spots for specimens identified
by PHW, grey spots for literature records, and white
spots for expected distribution.
The
worldwide distribution
of bumblebees in regions
with cool and strongly seasonal climates may be related
to two factors. First, the combination of annual colony
development with solitary hibernation by queens provides
an energy-inexpensive way of passing predictable, long
periods of unfavourable conditions. In comparison, it
is likely to be relatively energy-expensive to keep
a colony of honey bees sufficiently warm through long
cold winters. Second, bumblebees have been shown to
be able to choose to regulate their body temperatures
particularly effectively when necessary, so that they
can forage profitably at lower temperatures than honey
bees (Heinrich, 1979).
Bumblebees are therefore relatively cold-adapted insects,
and in Britain the group is not close to the extremes
of its latitudinal range.[Many British species have
very broad distributions in the Palaearctic
Region and were consequently among the first
species to be described.]
.
Patterns within
Britain
Within
Britain, regional differences in the bumblebee fauna
can be summarised from the BDMS atlas maps to show the
major shared patterns. This is done by classifying together
regions with similar species, and then classifying together
species with similar regional distributions (Williams,
1982). The large
Watsonian vice-counties were used as area units, rather
than BDMS atlas 10 x 10 km grid cells, because at this
stage it is the broad regional patterns that are of
interest. When all BDMS data are included in the analysis
as an estimate of distributions before 1960 (assuming
that '1960 onwards' records imply the presence of a
species before 1960, although range expansions cannot
be detected in these data), three main groups of species
are distinguished because of their differing distributions
among three regions (maps below).
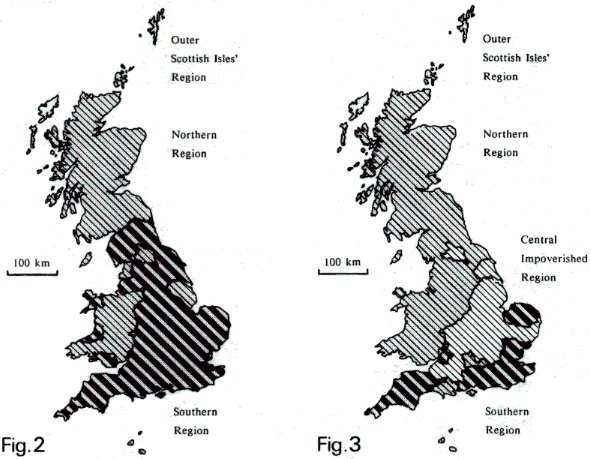
Above
left: map showing pre-1960 distribution of Bombus species
(excluding Psithyrus) in England, Wales and Scotland,
from a classification of all BDMS vice-county records.
Above right: map showing post-1960 distribution, from
a classification of '1960 onwards' BDMS vice-county
records (Williams, 1982).
- Mainland
Ubiquitous Species (diagonal
lines - all regions except the Outer Scottish Isles'
Region): B. hortorum, B. pascuorum, B. pratorum,
B. lucorum (and magnus), B. terrestris,
B. lapidarius and B. ruderarius.
- 'Widespread'
Local Species, after 1960 more northern and
western (dots - all regions except the Central Impoverished
Region): B. monticola, B. jonellus, B. soroeensis
and B. muscorum.
- Southern
Local Species (broad stripes - just the Southern
Region): B. subterraneus, B. ruderatus, B. sylvarum
and B. humilis.
[click
here for colour maps of species richness for the three
species groups among 10 x 10 km grid cells from BDMS
1960-onwards data]
As
early as 1959, Free
& Butler wrote that 'It is commonly supposed
that the bumblebee population has declined in recent
years.' Evidence for this can now be seen in the
BDMS atlas, which distinguishes pre-1960 and 1960 onwards
records. Another summary (British map in figure 3 above),
this time for the 1960 onwards records alone, shows
that two of the three groups of species have retreated
within Britain, so that only the Mainland Ubiquitous
Species remain strongly represented in the Central Impoverished
Region. This analysis shows that it is the loss of just
certain species from central England that is most dramatic.
Changes in distribution such as this provide opportunities
to exclude some factors and so narrow the range of those
that are likely to have a strong influence on species'
distributions.
To
help characterise the three groups of species with different
regional patterns of distribution within Britain, it
is useful to compare their distributions elsewhere in
Europe, such as Scandinavia (Løken, 1973)
and in the Alps (Pittioni, 1937).
Many of the species overlap broadly in distribution
across Europe, but differences in the regional and altitudinal
limits of the groups of species can be found. The first
group, the MAINLAND
UBIQUITOUS SPECIES, remains strongly represented
throughout mainland Britain, both before and after 1960.
These species generally do not reach distributional
limits within the lowlands of Britain and most are found
broadly across Scandinavia and the Alps. After 1960,
the second group, the 'WIDESPREAD'
LOCAL SPECIES, have become more restricted,
with most recent records coming from the north and west
of Britain, although some of the species also occur
in the south, particularly near the coasts. This group
of species is strongly represented in the arctic region
of northern Scandinavia. They do occur further south
in Europe, but mostly at higher altitudes, and especially
in the Alps. B. muscorum is unusual because it
occurs mainly near coasts, both in northern and southern
parts of western Europe. The third group, the SOUTHERN
LOCAL SPECIES, has also become more restricted
in Britain after 1960, but has retreated largely in
the opposite direction, to the far south. These species
reach their northern limits within Britain and southern
Scandinavia and occur only at lower altitudes in the
Alps. At least in Europe, their pre-1960 northern limits
follow just to the south of the July mean 15° C
isotherm (Williams, 1986).
Their northern limits may be even closer to the northern
European 250 mm contour of water deficit (the difference
between average annual precipitation and evapo-transpiration,
mapped by Polunin & Walters, 1985).
Thus in Britain, the regionally restricted species seem
to be near their range limits as governed by climate,
and it is these species that have been in apparent decline.
More
recently it has been possible to describe the climatic
niches of a few species more precisely, based on their
distributions in western Europe (Williams et al., 2007
[pdf]). This appears to support the idea that (1)
the declining species are those with narrower climatic
specialization; and (2) that it is areas closest to
the edges of their climatic niches where they are likely
to be most vulnerable.
.
Patterns within
Kent
To
find out more about the differences between the species
of the three groups, their distribution was studied
in Kent, within the Southern Region of Britain, where
all three groups can still be found together. The bumblebee
records collected by Gerald Dicker and Eric Philp (unpublished)
using a 2 x 2 km grid were used, because these are closer
to the size of the foraging areas used by individual
bumblebee colonies.
The
bumblebees that appear to be nearer the edges of their
ranges in Britain are also found at only a very few
localities within this range in Kent, where they all
tend to occur together (see the map below). These have
been called the 'local' species (Southern Local Species,
Widespread Local Species), as opposed to the 'ubiquitous'
species (Mainland Ubiquitous Species), which occur almost
everywhere both in Kent and elsewhere in the lowlands
of mainland Britain. In Kent, the distinction between
these two groups is very marked (Williams, 1988).
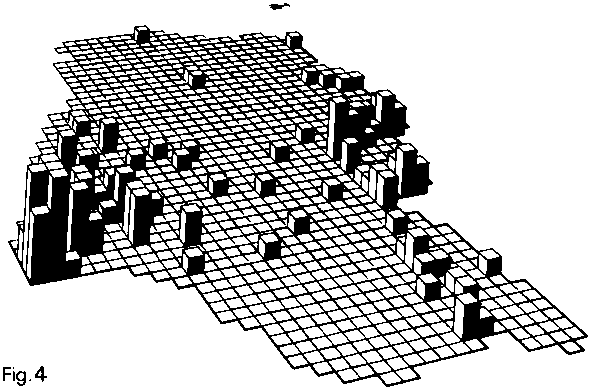
Above:
map showing numbers of local bumblebee species (0-6
species) recorded on a 2 x 2 km grid in Kent by G. Dicker
and E. Philp (unpublished) 1972-1978 (Williams, 1988).
The grid is viewed from across Folkestone towards London,
which lies beneath the north pointer. Dungeness, on
the southern coast, is on the far left. The Swale marshes,
on the mid-northern coast, to the right. Shoreham is
near the top of the grid.
[click
here for a colour map of species richness for the local
species among 2 x 2 km grid cells from 1972-onwards
data]
In
1983 I set out to try to characterise those localities
that support the local species (as well as the ubiquitous
species) in Kent. Only 20 sites could be surveyed, because
the different species are active at slightly different
times of the year (e.g. Prys-Jones & Corbet, 1987;
Williams, 1989a),
so in order to obtain comparable local counts of bumblebees,
these counts could be made during only a short period
of the summer. The results showed that although the
local species had previously been recorded from all
of these 20 sites, the local species could still be
found at just 10 of them.
I
used Tansley's (1939)
lists of plants associated with each of 16 major kinds
of vegetation to describe the habitat at each site.
First, I looked for the greatest variation in vegetation
composition among the sites (the principal components
analysis in Williams, 1988).
Coincidentally, this sorted the sites into two groups:
one group with the local bumblebee species; and one
group without them. It showed that the sites with the
local bumblebees also had many of the plants of saltmarsh,
shingle, sand dune, and to a much lesser extent, of
old meadow (see figure 5 below: x axis).
Second,
another approach is to search for the 'discriminant
function' that best separates the two groups of sites.
This simply attempts to find which among all of the
kinds of vegetation scored are the best indicators for
the presence of the local bumblebees (see figure 5 below:
y axis). The results are very similar, which
is shown in the comparison in figure 5 by the clusters
of points on the graph in the lower left and upper right
quadrants. But this analysis shows that, in addition,
hedgerow and heath are also particularly good indicators.
The difference is caused by the greater sensitivity
of the second method to kinds of vegetation that are
only weakly variable, but which vary more closely in
step with the presence of the local bumblebees.
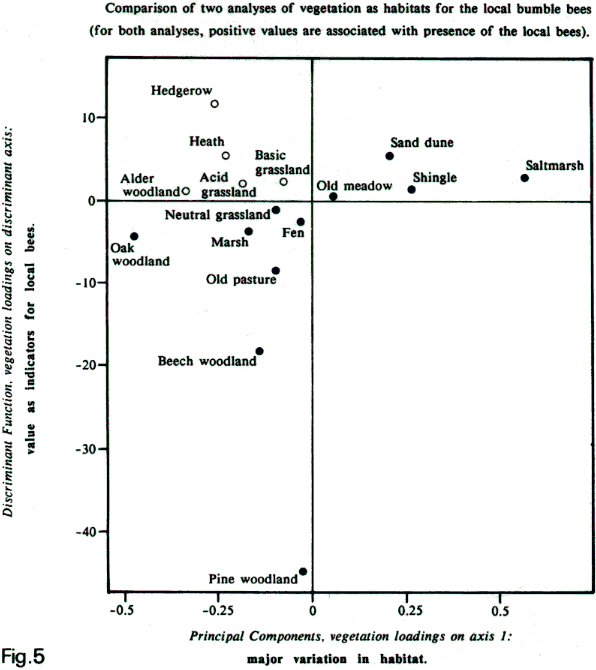
Above:
graphical comparison of two analyses (x axis: PCA and
y axis: discriminant function) of variation in vegetation
at 20 sites in Kent that were surveyed in 1983. Both
analyses distinguish completely between the 10 sites
with the local species and the 10 sites without them.
Similar results between the two analyses are shown by
the dark circles in the lower left quadrant (vegetation
associated with species-poor sites) and upper right
quadrants (vegetation associated with species-rich sites).
Divergent results between the two analyses are shown
by open circles, which are concentrated in the upper
left quadrant.
Hedgerow,
as used here, also includes woodland edge and scrub
vegetation. It includes the longest list of plants from
Tansley (1939) among
all of the kinds of vegetation in this analysis. Consequently,
it may be a better indicator of the general degree of
loss of plant diversity than assessments of the other
kinds of vegetation. The link between higher floral
diversity and lack of drastic disturbance over a long
period has been especially well documented for hedgerows
(Pollard, Hooper & Moore, 1974).
Heath is particularly
interesting in the context of habitats for local bumblebees,
because heathland is also important to many of the solitary
wasps and some of the solitary bees that are locally
restricted in southern Britain (George Else, pers. comm.).
The richest single site for local bumblebees in Kent,
Dungeness, has a particularly large number of Tansley's
shingle plants. But much of Dungeness has also been
classified in the past as heath in its broadest sense
(Hubbard, 1970). This
is not the same as heath in the strict sense, because
even the Common heather or Ling, Calluna vulgaris
(L.) Hull, is absent from most of Dungeness.
All
of these kinds of vegetation characterising the sites
where the local bumblebee species persist share a common
feature, in that they all present open (often grassy)
habitats with a lack of recent or drastic disturbance.
Crucially, these sites also support a greater abundance
of the ubiquitous species than the other sites, so they
appear to be more favourable to all bumblebees, irrespective
of whether they belong to the regionally and locally
restricted species or not (Williams, 1988).
.
Comparison
of local foraging patterns
In
order to find out what is special about the species-rich
localities for bumblebees in Kent, I have been visiting
Dungeness since 1974. By the 1980s, this area may have
more species of bumblebees than anywhere else in Britain.
In the summer of 1982, July and August were spent recording
flower visits by bumblebees over a survey area of 72
ha. The analysis of foraging patterns concentrates on
records collected during two weeks at the peak of foraging
activity, when competition is expected to be most intense.
This is the period when young queens and males are being
reared. The results are compared with the pattern of
flower visits seen during the same period of 1983 at
Shoreham. This is a more typical, species-poor locality,
also in Kent. The comparison allows a test of three
ideas about what governs the number of bumblebee species
at a locality (Williams, 1989a).
(1) The specialist
hypothesis is that the presence of a particular
species of bee (and therefore the number of species
of bees) might depend on the presence of a particular
food-plant species, if the bees were extreme specialists.
Løken (1961, 1973)
has found that the Scandinavian bumblebee B. consobrinus
Dahlbom showed a strong preference for visiting flowers
of Northern wolfsbane, Aconitum septentrionale
Koelle. In Scandinavia, the distribution of the bee
is restricted to the area within the distribution of
the plant, although the bee is believed to occur with
other species of Aconitum in areas eastwards
to the Pacific coast. In Kent, the preferred food plants
of the local bumblebee species can be identified at
Dungeness as those which were visited more often than
expected by chance alone. But contrary to what is expected
from the specialist hypothesis, these bees were not
associated with these plants where they occurred throughout
Kent.
For
an update on the discussion of the role of food-plant
specialization and bumblebee declines, see Goulson et
al. (2005) and Williams
(2005 [PDF]).
(2) The diversity
hypothesis is that the presence of a species of
bee might depend on the presence of food plants of kinds
not used by other bees, so that the species of bee is
not excluded by competition. For example, Inouye (1977)
applied this competition-based idea to bumblebees. He
expected that there would be a higher diversity of bumblebees
where there is a higher diversity of food plants, provided
that there is a broad range of flower depths available.
In Kent, at Dungeness where the diversity of bumblebees
is highest in terms of numbers of bumblebee species,
the diversity of food plants used is actually lower
than at the species-poor site at Shoreham. This result,
contrary to the diversity hypothesis, is obtained irrespective
of whether food-plant diversity is measured (a) as the
number of species of food-plants used; (b) as the range
of flower depths used; or (c) as how evenly the bees
shared their visits among the food plants (a more even
sharing of visits would represent a pattern of more
diverse flower use).
(3)
The abundance hypothesis is that the presence
of a species of bee might be governed by the balance
between local energy resources, in the form of food,
and local energy 'costs', which are likely to be influenced
by local climate. This is described by a simple macroecological
model of distribution, which has been elaborated to
account for the patterns described here (see the diagram
below). It is based on the idea that the individuals
of a species share a similar physiology that works better
in a region with a near-optimum climate for that species
(e.g. Andrewartha & Birch, 1954;
Hengeveld & Haeck, 1981).
Where the individuals find themselves a long way from
this optimum, food availability may not always be sufficient
to cover local 'costs', so that the species will not
persist at every locality. Consequently, this model
could account for the more patchy distributions of species
nearer to the edges of their distributions. In Kent
for instance, the bumblebee species nearer their distribution
limits are also more patchy. Furthermore, a concentric
pattern can be seen even within the British range of
some species that are 'sub-central' here in their global
distributions, such as B. lapidarius and B.
ruderarius (see Alford, 1980
[maps]
). These species are nearly ubiquitous in south-eastern
England, but are much more local in northern England,
and reach their northern limits in Scotland. Yet the
distribution patterns of some species are very patchy
even in the central regions of their distributions.
This can also be accounted for by the model, either
if some widespread patches of habitat were to provide
very little food, or if the species' range of tolerances
on either side of the optimum were very narrow. The
latter may be the case for some of the Southern Local
Species in particular. Thus the model implies that locally
abundant food could sometimes compensate for locally
suboptimal climate for some species (Williams, 1985a,
1988, Williams
et al., 2007
[pdf]).
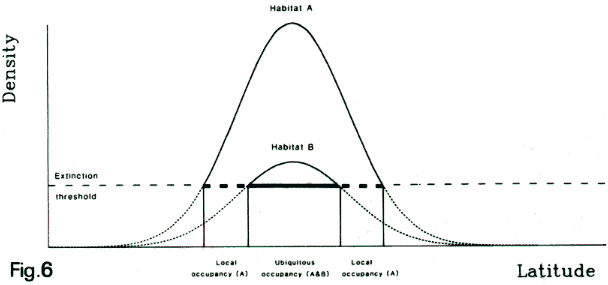
Above:
diagram of a 'marginal mosaic' model describing regional
patterns of favourability of habitats for a single species.
In this simplified illustration, the environment is
assumed to consist of a mosaic of just two kinds of
habitats, with higher (habitat A) and lower (habitat
B) food availability. The local abundance of the species
within each kind of habitat depends on the local foraging
profitability, which in turn depends on local climate
and hence (ignoring the effect of altitude) on latitude.
This results in the two density curves showing higher
values centred on the climatic optimum for the species.
If there is a lower limit to the density of the species
without it going locally extinct (shown by the horizontal
dotted line), then the species could have different
latitudinal limits in the different kinds of habitat.
Consequently, in regions nearer the edges of its distribution
range, a species may be more locally restricted to just
those habitats with most food (Williams, 1985a,
1988, Williams
et al., 2007
[pdf]).
Food resources
are very difficult to measure directly over a whole
site. There are severe difficulties in accounting for
variations in reward among flowers, both within and
between flower patches, and how these vary with time
of day, with weather, and with visits by bumblebees
and other insects.
Another approach
has been to examine the foraging patterns of the bumblebees
themselves and to interpret these in the context of
optimal foraging theory (see Cheverton, Kacelnik &
Krebs, 1985, and references
therein). This is possible because bumblebees appear
to show highly optimised foraging behaviour. For example,
bumblebee foragers learn to visit flowers with a depth
similar to their individual tongue lengths (e.g. Brian,
1957; Heinrich, 1979;
Morse, 1982; Plowright
& Laverty, 1984).
One explanation is that this results from a trade-off
between the sugar reward, which is greater in deeper
flowers (Prys-Jones, 1982),
and costs in the form of the time taken to collect the
reward, which increases dramatically when the flower
is deeper than the bee's tongue length (Harder, 1983).
Any departure from this pattern of flower choice is
likely to reduce the profitability of foraging below
the maximum that could be achieved.
As
expected, the relationship between tongue length and
flower choice was found at both Dungeness and Shoreham.
Intriguingly, the tongue lengths among the fewer bumblebee
species foraging at Shoreham were similar to those at
Dungeness (which has the same species as the whole of
Kent), so there is no evidence that only species with
shorter or longer tongues survive at the more species-poor
locality, Shoreham (see histograms below). Neither were
the bees at Shoreham more evenly different from one
another in tongue length, which might have been expected
if there were competitive 'thinning' of species (Williams,
1988).
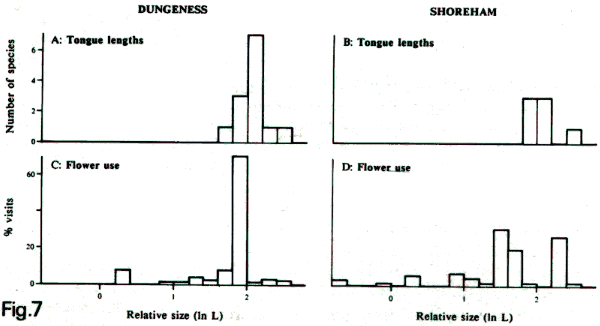
Above:
histograms showing numbers of species of bumblebees
with different tongue lengths at Shoreham and Dungeness
in Kent, together with the overall frequency of visits
to flowers of different depths at the two sites, both
by relative size (natural logarithm of length in mm)
(Williams, 1989a).
All records are for workers during two weeks at the
peak of foraging activity, when very few queens or males
and no 'robbing' of flowers were seen. (A) bumblebee
tongue lengths at Dungeness; (B) the same at Shoreham;
(C) flower use at Dungeness as a perecentage of visits
by bumblebees to different flower depth classes; (D)
the same at Shoreham.
However,
although at Dungeness the bumblebees visited flowers
closely similar in depth to their own tongue lengths
(histograms A,C above), at Shoreham many of the bees
visited flowers that were significantly shallower than
the lengths of their tongues (histograms B, D above).
This appears to be because there are not enough of the
deeper, more rewarding flowers for bumblebees at Shoreham.
Thus the crucial characteristic of the favourable habitats
at the sites where the local bumblebee species persist
may be that there are just more (a higher density) of
the most profitable food-plants at these sites (Williams,
1985a, 1989a).
The generality of this pattern throughout Kent has still
to be tested.
.
The changing
environment and
declines in British bumblebees
So
why have we lost so many of the bumblebee species from
central England? Elsewhere I have reviewed some of the
many possible factors, including competition from the
honey bee, the effects of predation and parasites, and
the effects of insecticides and herbicides (Williams,
1986; see also
Alford, 1973). None
of these agents is known either to select against the
local species alone, or to have changed particularly
in central England. This is not to deny them a role
in the decline of bumblebees (especially for pesticides),
it is merely that they are unlikely to be the principal
factors. However, two other factors, climate and vegetation,
have been suggested here as having particularly strong
influences on bumblebee distributions.
Climatologists
had claimed that the climate in Britain had warmed between
1850 and 1930, but had then showed a trend towards cooling
in the period covering the second date class of records
(1960-1976) in the BDMS atlas. bumblebee distribution
limits seem to show some relationship to differences
in summer climate with latitude and altitude. Therefore,
cooling might account for the southward retreat of the
Southern Local Species. However, cooling cannot easily
account for the northerly retreat of the Widespread
Local Species, unless a particularly strong increase
in climatic variance is to blame (Williams et al., 2007
[pdf]). Records of these species are generally more
frequent in the north and at slightly higher altitudes
in central Europe, so they might have been expected
to be favoured by a slight cooling of the climate in
Britain. Thus climate is unlikely to be the sole or
major factor.
Vegetation
can be profoundly affected by land use and one of the
largest proportional changes in Britain this century
has been through rapid urbanisation. All bumblebees,
and especially the local species, have been shown to
be favoured by certain kinds of vegetation. The ubiquitous
species of bumblebees may remain abundant, or may even
increase in abundance, in mature gardens in towns, though
it is possible that shortages of food immediately after
land clearance for building could eliminate the local
species, which are not known to survive well in these
areas. Nevertheless, urbanisation is not likely to have
affected the broader regional distribution of bumblebees,
because few of the vice-counties (the units used in
the regional classification) even approach complete
urban development.
More
than 80% of the total land area of Britain is used for
agriculture and since the Second World War, government
policy and resulting economic pressure has driven a
pronounced intensification of agriculture with an acceleration
of mechanisation. There is still a preponderance of
arable farming (especially wheat) in eastern England
and a preponderance of livestock in the wetter west
and north. But inevitably under this economic pressure,
much land that was previously considered to be of borderline
profitability (especially wet grassland), and frequently
allowed to remain relatively undisturbed, has been reclaimed
for cultivation, particularly in the central lowlands.
Field under-drainage, which has been most extensive
in the central and eastern counties, has usually been
the prelude to the conversion of pastures back to arable
use and to the first-time cultivation of pasture land,
including alluvial meadows and marsh. The Midlands have
been most affected by increases in the arable area and,
although the eastern counties have remained largely
arable in their farming, field sizes have been increased
to facilitate mechanisation, especially by the removal
of hedges. All of these changes are likely to have reduced
the amount of particularly favourable habitat that has
a greater abundance of the better food plants for bumblebees
(Williams, 1985a,
1986).
The
importance of changes in agricultural land use for the
decline of British bumblebees is supported by anectdotal
evidence from a few, well documented localities such
as Wicken Fen in central England. It also appears to
be continuing in the southern region at localities such
as the Rother Levels in Kent (Williams, 1986).
[Since 1989, the species B. subterraneus, B. ruderatus
and B. sylvarum may also have disappeared from
Dungeness, although B. soroeensis has been recorded
there for the first time.]
.
Bumblebee
declines elsewhere in Europe
In
the former East Germany, a similar decline in most of
the same species has been reported by Peters (1972).
He believed that this was caused by a trend towards
uniformity in agricultural landscapes and by the use
of pesticides.
In Belgium
and northern France, a decline in many of the same bumblebees
has been described by Rasmont (1988).
He also concluded that this has been caused primarily
by degradation of open habitats with a consequent loss
of food plants. He placed particular emphasis on plants
of the families Leguminosae and Compositae for the local
and declining species of bumblebees.
Rasmont (1988)
found that in a survey of the Languedoc-Rousillon region
of southern France, the more locally restricted bumblebees
visited a narrower range of food plants. He concluded
that the between how many food plants a bumblebee species
uses and how widespread it is explains why some species
are more widespread than others. However, this relationship
is expected as an effect of sample size alone. This
explanation was rejected because he found no correlation
between the average local abundance of a bee species
and the total number of food plants recorded for it
from Languedoc-Rousillon. However, the pattern might
be obscured because so many different climatic regions
and habitats were included: the Languedoc-Rousillon
survey area includes a broad altitudinal and climatic
range, which is equivalent to several regions of the
kind defined for Britain. For instance, some of the
French bumblebees are restricted to the subalpine zone,
so even if they were locally abundant and using many
food-plant species, their total number of food plants
for Languedoc-Rousillon could still amount to fewer
than for the more widespread species, simply because
they are rarer when considered among all samples.
The
pattern whereby the local bumblebees use a narrower
range of food plants than the ubiquitous bumblebees
was not found at Dungeness (Median test for a difference
between the numbers of food-plant species used by ubiquitous
and local species of bumblebees at Dungeness, Fisher
exact p = 0.38), where two of the local species
actually visited more species of food plants than any
of the ubiquitous species. But when the comparison was
extended to all 20 of the sites surveyed in Kent, where
the local species tend to be much less abundant, then
a correlation was found between the average local number
of bees per species and the average local number of
food-plant species for that bee species (Kendall correlation,
tau = 0.94, p < 0.001). Thus smaller
sample sizes for the rarer local species alone, rather
than narrower food-plant specialisation, may be sufficient
to explain why the locally restricted bumblebees may
appear to use fewer food-plant species.
Food-plant
specialization was also proposed as an explanation for
bumblebee declines in Britain by Goulson et al.
(2005), but the apparent
relationship disappeared when allowance was made for
factors such as sample size (Williams, 2005
[PDF]).
A correlation
between bumblebee range sizes and numbers of food plants
used would not be expected to result from innate specialisation
by the local bees to particular plant species. Previous
studies have shown that bumblebees usually learn to
visit the most rewarding flowers that happen to be common
in their local foraging areas (e.g. Heinrich, 1979).
Furthermore, the test of the specialist hypothesis at
Dungeness showed that the local bees are not distributed
together with the same preferred food plants throughout
Kent.
.
Conclusion
This brief
summary of bumblebee distributions and their decline
in Britain shows that undoubtedly many factors in the
changing environment could have contributed to
the impoverishment of the bumblebee fauna in some areas.
A general problem in the interpretation of distribution
patterns is that these factors may be closely correlated
with one another, so that their effects would be much
more difficult to disentangle were it not for the changes
in bumblebee distributions in the last few decades.
If it were necessary to identify the single most important
factor to have affected the decline of British bumblebees
then this study helps by showing that it is the loss
of open habitats rich in certain kinds of food plants
that is the most likely candidate. More precisely, it
may not be necessarily a reduction in the number of
species of flowering plants at a locality that is important,
but rather a decrease in the abundance of the most rewarding
food plants. Since most worker bumblebees in Kent have
tongue lengths in the range 5-13 mm, and more especially
in the range 7-9 mm (figure 7A), then flowers with similar
depths are likely to be most valuable (Williams, 1985a,
1989a).
research publications
| books on British bumblebees
| links and credits
 top of pag
|