Skip navigation

The NaturePlus Forums will be offline from mid August 2018. The content has been saved and it will always be possible to see and refer to archived posts, but not to post new items. This decision has been made in light of technical problems with the forum, which cannot be fixed or upgraded.

We'd like to take this opportunity to thank everyone who has contributed to the very great success of the forums and to the community spirit there. We plan to create new community features and services in the future so please watch this space for developments in this area. In the meantime if you have any questions then please email:

Fossil enquiries: esid@nhm.ac.uk
Life Sciences & Mineralogy enquiries: bug@nhm.ac.uk
Commercial enquiries: ias1@nhm.ac.uk

Citizen science blog

2 Posts tagged with the data_analysis tag
1

Today one of our Microverse citizen science project participants, Robert Milne, presents his own interpretation of the results of the microbial samples collected from Mid Kent College in Gillingham where he is a student:


The results:


Despite our best efforts, the samples we obtained for the Microverse project were taken in different weather conditions, at slightly different times, in slightly different areas of the building, and all three samples were taken from walls facing different directions. The materials of the surfaces we sampled were brick, glass and metal.


206A_JPG0001.jpg

Mid Kent College building, swabbed by The Microverse participants.


From the results below, it can be seen that all three surfaces have about the same number of OTUs, (Operational Taxonomic Units, a phrase to indicate taxonomic groupings in microorganisms), but this does not mean that each surface has the same number of individual microorganisms. The number of genetic sequences varies greatly.


Sample Area A

(brick)

Sample Area B

(glass)

Sample Area C

(metal)

Number of genetic sequences generated88,264120,49827,894
Number of OTUs2,1982,1071,960
% of sequences that were from Archaea0.02%0.00%0.00%
% of sequences that were from Bacteria75.62%88.76%87.75%
% of sequences that were from Eukaryotes24.36%11.24%12.19%


Table 1: Results from samples of microorganisms swabbed from brick, glass and metal, at Mid Kent College, Gillingham, (% rounded to 2 decimal places).


The glass surface has generated the most genetic sequences while metal has generated the least. This could mean that the bacteria on the surface of the glass are more successful than the ones on the metal, for instance.


206A_JPG0002.jpg

Sample Area A - Brick.


The image above shows the brick wall from which the first sample was taken. This wall had the most eukaryotic cells present, in which the majority of them contained chloroplasts (these are the organelles of plants that convert light energy into sugar).


This wall faces southwest and a wall facing south of any kind will always receive the most sunlight on it during the day, which could explain the increased chloroplast numbers compared to the other two surface areas we sampled. The fact that this wall was also close to a lot of grass could also play a part in these numbers.


206B_JPG0002.jpg

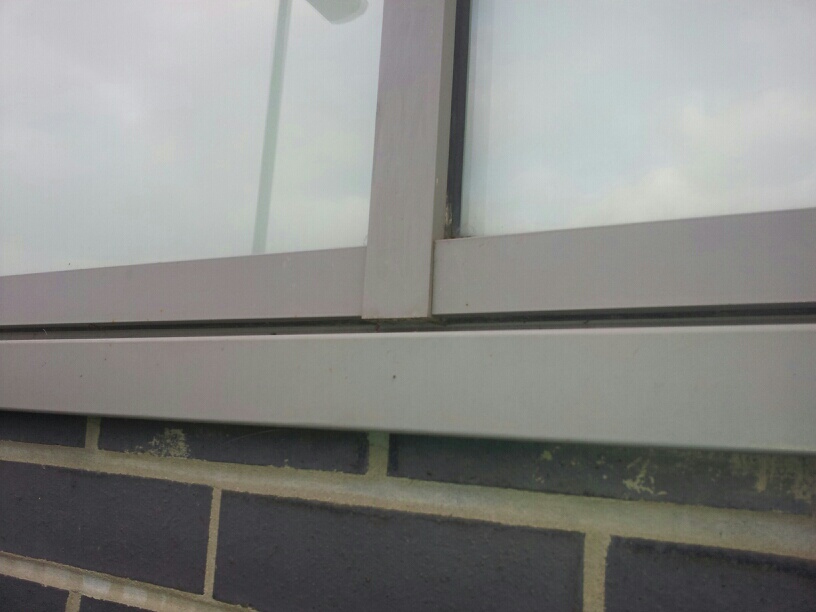
Sample Area B - Glass.


The image above shows the second surface sampled, which was glass. This had the most genetic sequences found out of all three of the surfaces we swabbed. There were, however, less eukaryotic cells on the glass and metal surfaces than on the wall.


This could be because the smooth surface of the metal and the glass meant that less eukaryote cells could remain on the surfaces for prolonged periods. The eukaryotic cells (represented by the mitochondria and chloroplast sequences in the sample) could have originated from natural wildlife around the area, such as a snail's trail or some spider webbing.


206C_JPG0002.jpg

Sample Area C - Metal.


Most of the eukaryote sequences found in all samples were chloroplasts, rather than mitochondria. This probably means the surfaces always have some form of sunlight on them, which is somewhat true since all the surfaces faced either west or east to some extent.


206 Relative abundance chart.jpg

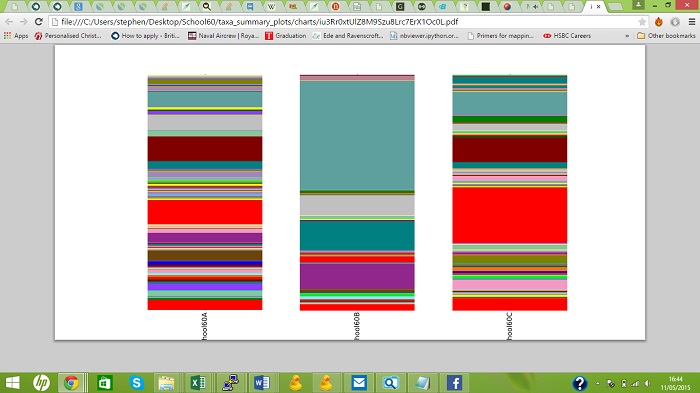
Figure 1: The relative abundance of bacterial phyla, archaea, mitochondria and chloroplasts in the three samples.


Possible uses:


One of the prime examples for undertaking this feat of exploring more of the microbiological world is the need to find better antibiotics; resistance to antibiotics is an increasing threat in the world of medicine. Antibiotic discovery can occur via the identification of bacteria that produce chemical substances that kill or inhibit the growth of other bacteria. Once identified the chemical substance can potentially be cultured and used as a treatment to kill off bacterial infections.


Exploring the countless surfaces outside in the world is a treasure trove of information that could lead to the discoveries of new bacteria that can be used effectively as a source for an antibiotic.


However, it can also be considered that a new resilient bacteria could be discovered that can survive without much water for a long time, which may, just maybe, hold a specific DNA sequence to help relieve the effects of hunger and thirst in patients that must undergo a fast before an operation (such as colon screening). It can open up a number of new doors to the world of medicine, and with a huge percent of areas still not investigated, it could only be a matter of time before huge changes are discovered.


Robert Milne


Thank you Robert! Robert Milne is a student of Mid Kent College, who has just finished his second year of an Applied Science Level 3 course. He has a keen interest in biochemistry and genetics and hopes to enrol this Autumn on an Undergraduate degree in Chemistry at the University of Greenwich. To find out more about the Museum's citizen science projects, see our website.

0

This week we hear from volunteer Stephen Chandler, who has been supporting The Microverse project by using computer software to identify the taxonomic groupings of the DNA sequences revealed in the sequencing machine.


Due to the size of microorganisms, we have until recent years relied on microscopes to identify different species. The advancement of scientific technologies however has made it possible for scientists to extract DNA from microorganisms, amplify that DNA into large quantities and then put the samples into a sequencing machine to reveal the genetic sequences. In The Microverse project, my role begins when the sequencer has finished processing the samples.

RawFile2cropped.jpg

A raw data file from the MiSeq machine.


When the gene sequencer has finished decoding the PCR products it creates a file much like a typical excel file. The main difference is that this file can be incredibly large as it contains millions of DNA sequences belonging to hundreds if not thousands of species. This requires a powerful computer to run the analysis to identify what is in the sample.


At the Museum we use a number of servers with huge memory capacities and processing capabilities. To give an idea of the power these machines have compared to an everyday computer; a server at the Museum has at least 1.5TB (Terabytes) of RAM, that’s 300 times more processing power than your average computer, which has 4-6GB (Gigabytes) of RAM.


In order to use this computing power, the server needs to have a program designed to analyse and identify the DNA sequences, using a reference database of DNA for that group of organisms. To do this I use a program called QIIME (Quantative Insights Into Microbial Ecology).


QIIME2cropped.jpg

The QIIME terminal, where the computer code is inputed to process the sequences.


The process of turning a raw sequence file listing all the DNA sequences, hot from the gene sequencer, into something that can be used to create graphs is not an easy task, especially when you have hundreds of thousands of sequences, as for the Microverse project.


The first step is to remove low quality sequences that have errors. Then the sequences within a sample are grouped together into Operational Taxonomic Units (OTUs), according to their similarity. Sequences that are at least 97% similar to each other are grouped into one undefined OTU. The OTUs that are found are then compared to a reference database containing hundreds of thousands of specific species, and other taxonomic groupings, to identify which type of organisms they are.


listingscropped.jpg

A nearly completed file. All the sequences have been identified, but now need to be put into an order.


Some of the bacteria that we find are common and you can find them living on most surfaces in our home or garden, but others are incredibly rare and have evolved to survive in the most competitive and extreme environments. And all this microscopic life and diversity can all be found living just outside the front door. Although in the Microverse project no sample or result seems to be quite the same, which makes this a very exciting project.


graph example 2.jpg

Three coloumn graphs representing the relative abundance of different microorganisms identified in three different samples.


Stephen Chandler


Stephen Chandler obtained a degree in marine biology at Portsmouth University and then went on to complete his masters at Imperial College London in ecology, conservation, and evolution in 2014. Stephen’s ambition is to study for a PhD and he is particularly interested in studying microorganisms in marine environments.


Stephen.JPG

Stephen taking samples from the pocket roof of St Paul's Cathedral.


And now a brief word from Dr. Anne Jungblut, on careers in genomic science:


More and more research in biology, ecology and medicine is based on DNA and genome sequencing. The research relies on specialist software and programming in order to be able to analyse data sets as big as the Microverse sequence data, with future genomics projects likely to be much much bigger than our current project. 


Along with specialist software the field will also need more and more different types of experts working on DNA projects to tackle future challenges in science, ranging from people interested in going outside to collect field data, molecular biologists that know how to do laboratory work to extract high quality DNA and run sequencing machines, to people that love concentrating on data analysis by applying specialist software, writing programming scripts or even develop new bioinformatics programs.


Anne Jungblut